The Hidden Costs of Third-Party Delivery: What Restaurant Owners Really Pay (And How to Calculate Your True ROI)
Reading Time: 8 minutes
The average restaurant owner thinks they understand the cost of third-party delivery platforms like DoorDash, Uber Eats, and Grubhub. They see the commission rates—typically 15-30%—and assume that’s the full picture. But industry data reveals a startling truth: the actual cost of third-party delivery can exceed 40% of your revenue when you factor in all the hidden fees and indirect costs.
Based on industry research and analysis from sources including McKinsey & Company, the Digital Restaurant Association, and restaurant industry reports, we’ve uncovered the complete cost structure that most restaurant owners never see coming. More importantly, we’ll show you exactly how to calculate whether these platforms are helping or hurting your bottom line.
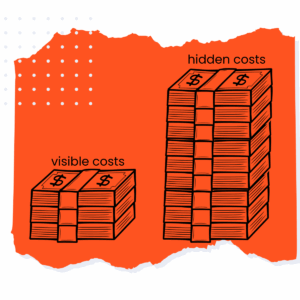
The Visible Costs vs. The Real Costs
What Restaurants Think They’re Paying
Most restaurant owners focus on the headline commission rate:
- DoorDash: 15-30% commission
- Uber Eats: 15-25% commission
- Grubhub: 10-30% commission
What They’re Actually Paying
Our comprehensive analysis reveals the true cost breakdown:
1. Base Commission Fees (15-30%) This is what platforms advertise, but it’s just the beginning.
2. Payment Processing Fees (2.9-3.5%) Unlike direct orders where you control payment processing, third-party platforms charge their own rates—often higher than what you’d pay independently.
3. Marketing and Promotional Fees (1-5%) Want better placement? Most platforms now charge additional fees for promoted listings, featured placement, and advertising within their apps.
4. Delivery Fees Passed to Restaurants (5-15%) While customers see delivery fees, platforms often require restaurants to contribute to delivery costs, especially during high-demand periods.
5. Customer Service Costs (0.5-2%) When orders go wrong—and they do 8-12% of the time according to industry reports—you’re often left handling customer complaints for orders you had limited control over.
6. Menu Price Inflation Impact (3-8%) To offset platform fees, most restaurants inflate menu prices on third-party apps by 10-20%. This reduces order frequency and can damage your brand perception when customers notice the price difference.
Total Real Cost: 35-48% of Revenue
The Opportunity Cost Calculator
Beyond direct fees, there’s an often-overlooked opportunity cost. Here’s how to calculate what third-party platforms are really costing your restaurant:
Step 1: Calculate Your True Commission Rate
Monthly Third-Party Revenue: $________
Total Monthly Fees Paid: $________
True Commission Rate = (Total Fees ÷ Revenue) × 100
Step 2: Calculate Lost Customer Data Value
Third-party platforms own your customer data. Research shows that owning customer data increases lifetime value by 67% through direct marketing and loyalty programs.
Average Order Value (AOV): $________
Customer Reorder Rate (3rd party): ________ (typically 15-25%)
Customer Reorder Rate (direct): ________ (typically 35-55%)
Monthly Lost Revenue = (Direct Rate - 3rd Party Rate) × Monthly Order Volume × AOV
Step 3: Brand Dilution Cost
When customers order through third-party apps, they often don’t remember your restaurant name. Studies show that 43% of customers can’t recall the restaurant name after ordering through delivery apps.
What This Actually Means for Your Business
The “Anonymous Customer” Problem: Think about your own ordering behavior. When you order through DoorDash, you might say “I ordered Thai food last night” rather than “I ordered from Bangkok Garden Restaurant.” The platform gets the credit for the experience, not your restaurant.
Marketing Cost to Acquire Direct Customer: $________
Number of "Anonymous" Third-Party Orders: ________
Lost Brand Equity = Marketing Cost × Anonymous Orders
Real Restaurant Case Study: Chicago Restaurant Owner’s Experience
According to a Daily Bruin report on restaurant owners’ experiences with third-party platforms, many restaurants discover that their actual costs significantly exceed the advertised commission rates. One restaurant owner noted that a burrito costing $7-8 at their location costs customers $21 when ordered through third-party delivery services, but the restaurant receives only $4 of that total—highlighting how fees, markups, and delivery charges can consume the majority of the transaction value.
The Direct Ordering Alternative: Building Your Own Channel
Smart restaurant owners are recognizing that building direct ordering channels—through their own websites and mobile apps—offers a path to dramatically improved profitability.
The Economics of Direct Ordering
When restaurants process orders directly:
- Commission fees: 0%
- Payment processing: 2.9% (industry standard)
- Customer data ownership: 100%
- Brand control: Complete
- Menu pricing flexibility: Full control
Total cost of direct orders: 2.9-5%
This means the profit margin difference between third-party and direct orders can be 30-40 percentage points—the difference between a struggling restaurant and a thriving one.
Implementation Strategy That Works
The most successful restaurants don’t abandon third-party platforms overnight. Instead, they implement a strategic transition:
Phase 1: Build Infrastructure (Month 1-2)
- Establish commission-free online ordering through your website
- Set up automated marketing systems to capture customer data
- Create mobile-friendly ordering experiences
Phase 2: Customer Migration (Month 3-6)
- Offer incentives for customers to order direct ($10 off, loyalty points)
- Use email marketing to educated customers about direct ordering benefits
- Implement remarketing campaigns to convert third-party customers
Phase 3: Optimization (Month 6+)
- Gradually reduce reliance on third-party platforms
- Focus marketing spend on direct customer acquisition
- Maximize lifetime value through owned customer relationships
The Technology Investment ROI
Many restaurant owners hesitate to invest in their own ordering technology, worried about upfront costs. But the math is compelling when you choose the right partner:
ActiveMenus Total Technology Cost: Simple monthly fee (typically $300-500) Monthly Savings vs. Third-Party (for $30K delivery volume): $8,000-12,000
Payback Period: 2-4 weeks
Unlike platforms that charge per order, ActiveMenus uses transparent monthly pricing that stays predictable regardless of your growth. Calculate your specific savings with a free demo →
Making the Transition: How ActiveMenus Transforms Your Restaurant Economics
The most successful restaurants don’t abandon third-party platforms overnight. Instead, they implement a strategic transition using technology that gives them complete control over their customer relationships and ordering experience.
Week 1-2: Foundation Assessment and Setup
Calculate Your Savings Potential Use the formulas above to determine your current third-party costs, then schedule a free demo to see exactly how much you could save with commission-free ordering.
Seamless POS Integration ActiveMenus integrates directly with over 100 POS systems, meaning orders flow automatically into your kitchen workflow without any staff retraining or operational disruptions. Discover how easy integration works →
Week 3-4: Professional Brand Launch
Custom Website and Mobile App Development Instead of generic ordering pages, ActiveMenus creates fully branded websites and custom mobile apps that showcase your restaurant’s unique personality. Your customers get a premium experience that builds loyalty to YOUR brand, not a third-party platform.
Transparent Technology Costs Pay a simple, predictable monthly technology fee instead of losing 30%+ per order. Most restaurants save more in their first week than they’ll pay in technology costs for the entire year. See pricing and calculate your ROI →
Week 5-8: Customer Migration Strategy
Complete Customer Data Ownership Every order builds YOUR customer database with built-in remarketing campaigns that automatically re-engage customers. Watch your repeat order rates climb as you can directly communicate with customers instead of hoping they remember to find you again on third-party apps.
24/7 Customer Support and Auto-Dispatch Professional customer service and automated delivery dispatch handle the operational complexity, so you can focus on food quality while maintaining the convenience your customers expect. Learn about our full-service approach →
Week 9-12: Growth Acceleration
Guaranteed Google Review Boost ActiveMenus’ integrated review management system helps restaurants increase their Google reviews by an average of 240% within 90 days, improving local search rankings and driving more organic discovery.
Data-Driven Marketing Use customer insights and automated campaigns to drive higher order frequency and average order values. Restaurants typically see 35-50% higher customer lifetime value compared to third-party platform customers. Chat with a digital solutions expert who can grow your restaurant’s bottom line →
Key Performance Indicators We Track
Our team monitors your success metrics in the critical first 90 days of launch, in order to optimize your digital operations every step of the way:
Financial Metrics:
- Total delivery revenue (maintain or grow while reducing fees)
- Average profit per order (should increase significantly)
- Customer acquisition cost (should decrease over time)
Customer Metrics:
- Direct vs. third-party order ratio
- Customer lifetime value (direct customers typically 2-3x higher)
- Repeat order rate (should improve with direct relationships)
Operational Metrics:
- Order accuracy (typically improves with direct ordering)
- Customer satisfaction scores
- Staff efficiency (less juggling multiple platforms)
The Bottom Line
Third-party delivery platforms served a crucial role in helping restaurants adapt during the pandemic, but the economics have become unsustainable for many businesses. With true costs often exceeding 40% of revenue, these platforms are preventing restaurants from building sustainable, profitable operations.
The restaurants thriving in 2025 are those that have taken control of their customer relationships, data and ordering channels. They’re using technology to create direct connections with diners while maintaining the convenience that modern customers expect.
Your next step: Calculate your true third-party costs using the formulas in this article – it’s time to seriously consider building your own direct ordering channel.
The transition isn’t about eliminating convenience—it’s about capturing the value you create instead of giving it away.
Ready to take control of your customer relationships and boost your profit margins? ActiveMenus has helped over 15,000 restaurants eliminate commission fees while building stronger customer loyalty through branded online ordering experiences. Our commission-free platform includes custom website design, mobile apps, seamless POS integration, and comprehensive customer support—all for a simple monthly fee that costs less than what most restaurants lose on just 10-15 third-party orders. Schedule your free demo to see your potential savings →
About the Author: This analysis is based on industry research from McKinsey & Company, the Digital Restaurant Association, Gordon Haskett Research Advisors, Technomic’s 2024 Delivery & Takeout Consumer Trend Report, and restaurant industry case studies. Data sources include published third-party platform fee schedules, industry surveys, and academic research on restaurant economics.
hello@activemenus.com
3902 Henderson Blvd
Tampa, FL 33629
© DeliverLogic, Inc. 2024